Where Are The Opportunities In Singapore’s Property Market?
Blogs16 Oct 202610 min read

Where Are The Opportunities In Singapore’s Property Market?
Singapore’s private residential prices have risen steadily over the years, even as global interest rates, geopolitical tensions and cooling measures have impacted the market. In this article, we take a closer look at what is driving this resilience and follow the data to the next pocket of opportunity.
Land Cost is the Silent Driver Behind New Launch Prices.
A closer look at land prices reveal that what developers are willing to pay for land is a good indicator of future new launch prices.
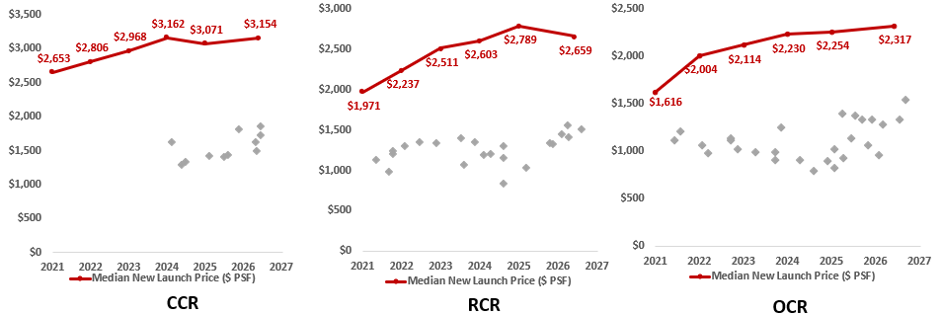
Chart 1: Trendline of Land Cost & New Launch Price in different market segments
Based on non-landed transactions only, excluding ECs.
Land bids for sites in the Core Central Region (CCR) have stepped up. Before 2026, most bids sat between $1,285 and $1,432 psf ppr. In 2026 all four bids came in at $1,491 psf ppr or more, topped by $1,865 psf ppr for Peck Hay Road Site in June, which is 45% above the $1,285 psf ppr bid for Holland Drive in May 2024.
However, median new launch prices have climbed at a slower pace of 19%, increasing from $2,653 psf in 2021 to $3,154 psf in 2026. Land prices in CCR is increasing at a faster pace than launch prices, which indicates strong competition for residential land in CCR.
In 2024, bids for residential land in RCR were as low as $841 psf ppr for De Souza Avenue GLS before surging to $1,415 psf ppr or above in 2026. This year saw the Dover Drive GLS site set a record high of $1,556 psf ppr in March. The land bids for RCR residential sites ranged from $1,415 to $1,556 psf ppr this year, higher than the previous year’s land bids which ranged from $1,037 to $1,338 psf ppr.
Median new launch prices rose by 35% from $1,971 psf in 2021 to $2,659 psf by Q2 2026, so land is again rising faster than prices.
The Outside Central Region has seen the sharpest turnaround. Land bids bottomed out in 2024, with a low of $793 psf ppr for Canberra Crescent, and have recovered quickly. The September 2026 bid of $1,537 psf ppr (New Upper Changi Road) is a new OCR record-high, breaking the previous record of $1,388 psf ppr for Bayshore Road in 2025.
The Bedok Rise tender drew 10 bidders when the tender for the site closed in November 2025, the most competitive OCR tender in years, and Bayshore Drive followed in July at $1,323 psf ppr. Bids this year range from $962 to $1,537 psf ppr, compared to last year’s range of $821 to $1,388 psf ppr.
Median new launch prices climbed from $1,616 psf in 2021 to $2,317 psf by Q2 2026, up 43%.
The cushion between land cost and launch price has narrowed since 2024. Median launch price as a multiple of the average land bid has fallen from about 2.2x to 1.9x in the CCR, from 2.3x to 1.8x in the RCR and from 2.6x to 1.8x in the OCR. The rising land cost leaves developers less room to absorb higher costs unless they increase launch prices. Therefore, the land bid prices of today tend to impact the launch prices of new projects over the next one to two years.
More Million-Dollar HDB Flats, More Upgraders to Condos
The HDB resale market tells a parallel story. The number of million-dollar HDB transactions has grown sharply from just 12 in 2015 to 1,035 in 2025, with 903 million-dollar flats already transacted in the first half of 2026 alone.
Chart 2: Number of MOP flats in a year in comparison with number of million-dollar flat transactions.
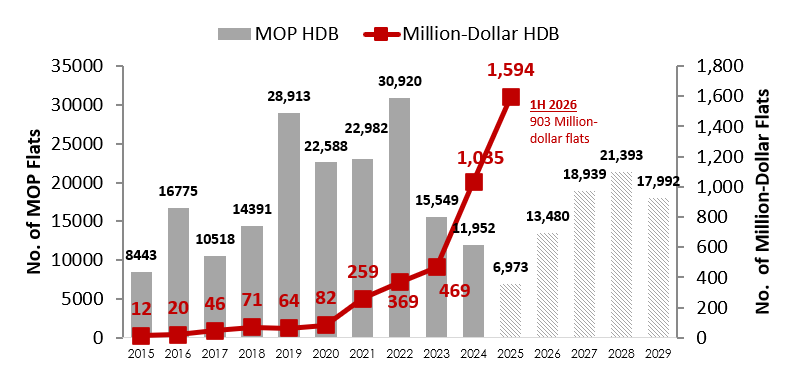
The increase in the number of flats reaching their Minimum Occupation Period (MOP) is driving the growing number of million-dollar deals. MOP flats are projected to rise from 13,480 in 2026 to 21,393 by 2028, providing the resale market with a steady supply of newly available flats. Flats that have just obtained MOP tend to attract high prices because of their long remaining tenure.
In 2026, the towns contributing the most MOP flats are Punggol with 3,222 units, Queenstown with 2,405, Tampines with 2,133, Toa Payoh with 1,594, and Bedok with 1,440, a mix of newer estates maturing alongside older, more central towns.
At the same time, the overall housing mix is shifting. This is visible in the changing composition of resident households:
Chart 3: Resident households in different property types in 2026 and 2015
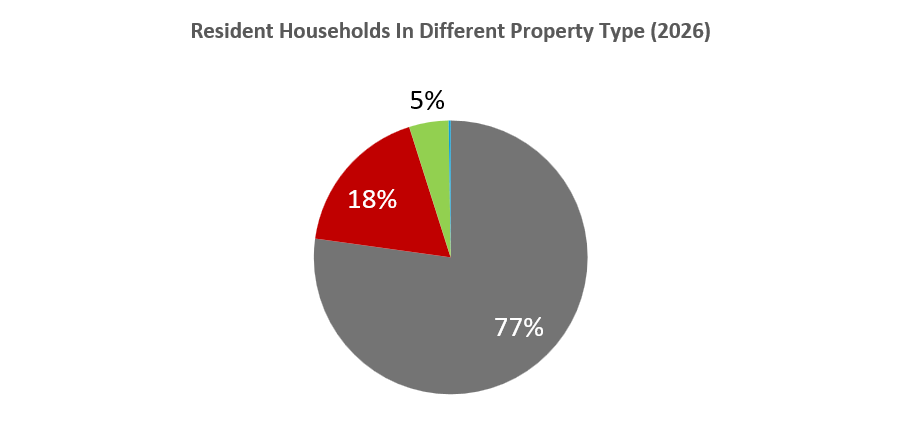
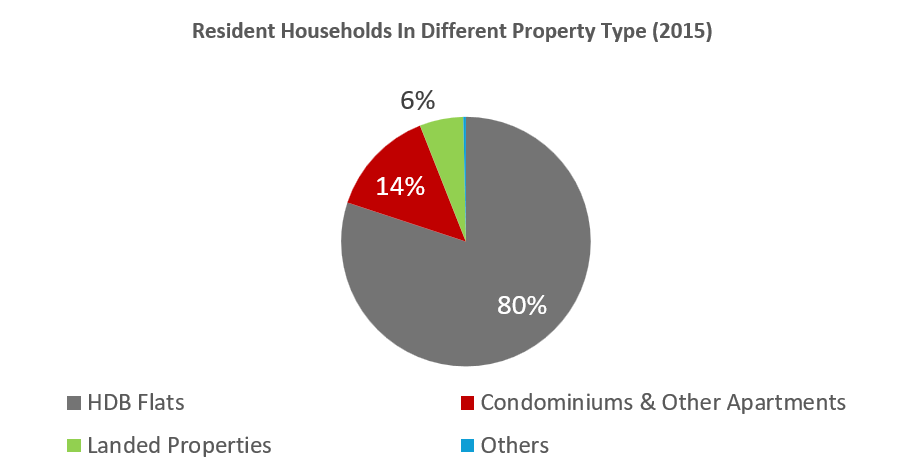
HDB's share of resident households has slipped from 80% in 2015 to 77% in 2025, while the number of households living condominiums and apartments has grown from 14% to 18%. As more HDB owners cash out record resale gains and upgrade, private housing demand gets a structural boost.
New Housing Precincts Are Spreading Value Beyond the City Fringe
The latest masterplan creates new housing precincts across the island, with nearby transport links and amenities. This creates a self-sustaining township that supports a more balanced and resilient property market. Long-term property value tends to emerge where housing, infrastructure and employment flourish together.
Chart 4: Median psf of resale non-landed homes in the five outperforming districts, Q2 2022 to Q2 2026.
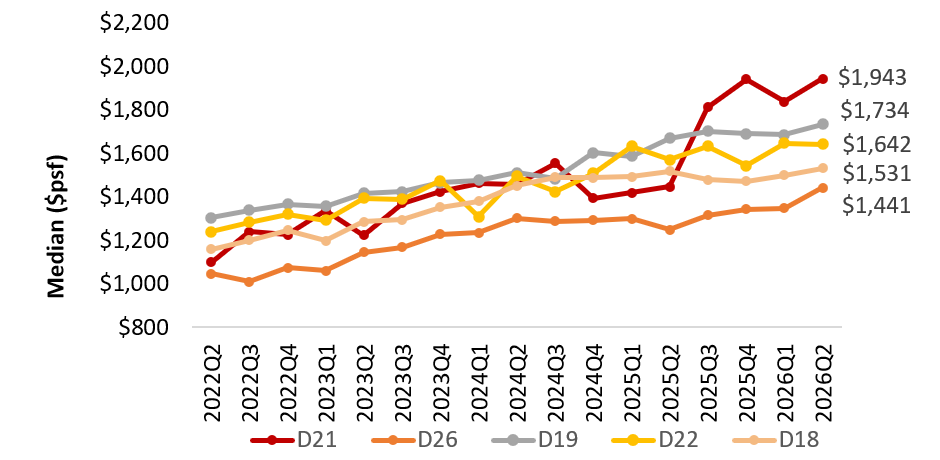
Table 1: Median PSF Of 99 Year Non-Landed Resale Homes Excluding EC For the Top Five Performing Districts.
District | Areas | Median psf | Median psf | % Change |
|---|---|---|---|---|
D21 | Upper Bukit Timah, Clementi Park, Ulu Pandan | $1,099 | $1,943 | +77% |
D26 | Upper Thomson, Springleaf | $1,045 | $1,441 | +38% |
D19 | Serangoon Garden, Hougang, Punggol | $1,304 | $1,734 | +33% |
D22 | Jurong | $1,239 | $1,642 | +33% |
D18 | Tampines, Pasir Ris | $1,159 | $1,531 | +32% |
Source: URA, HDB, ERA Research and Market Intelligence. Median psf of 99-year leasehold resale non-landed homes.
Over the four years to Q2 2026, median resale price for 99-year leasehold condominiums from five districts outperformed the islandwide median, with gains of 32% to 77%. District 21 led at 77% (from $1,099 to $1,943 psf), followed by District 26 at 38%, then District 19, District 22 and District 18 at about 33% each.
Up to Q2 2025, four of the five districts had grown at a similar pace of approximately 27% to 32%. Over the last four quarters, the median resale price for District 21 gained a further 34.5% while that for District 26 grew by 15.5%. However, the median resale price for District 22, District 19 and District 18 added only 4.6%, 3.9% and 1.0%. District 21’s median resale price jumped by 25% in Q3 2025, from $1,445 to $1,812 psf, and has held between $1,800 and $1,950 psf since, inching up by a further 7% to $1,943 psf by Q2 2026.
Of the five districts, District 26 has the most potential for further price growth It is still the cheapest of the five with a median resale price of $1,441 psf, but resale prices for the district is expected to increase as more units from newer projects becomes available in the resale market. District 26 includes the Lentor and Springleaf neighbourhoods where numerous new developments are starting to obtain their temporary occupation permit.
District 22 (Jurong) is expected to benefit from the on-going transformation of Jurong Lake District while Districts 19 (Punggol) and 18 (Tampines)are expected to benefit from upgrader demand due to the influx of MOP flats in these towns.
The Two Numbers That Move Housing: Household Income & Population
When analysing demand for housing, two numbers are very important: household income and population. An increase in population lends support to housing demand while rising household income improves affordability.
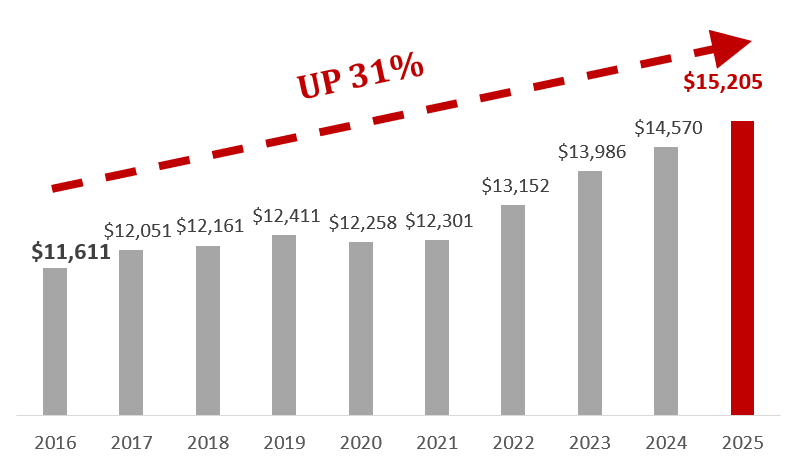
The average monthly household income rose by 31% from $11,611 in 2016 to $15,205 in 2025.
Chart 5: Average monthly household income from 2016 to 2025.
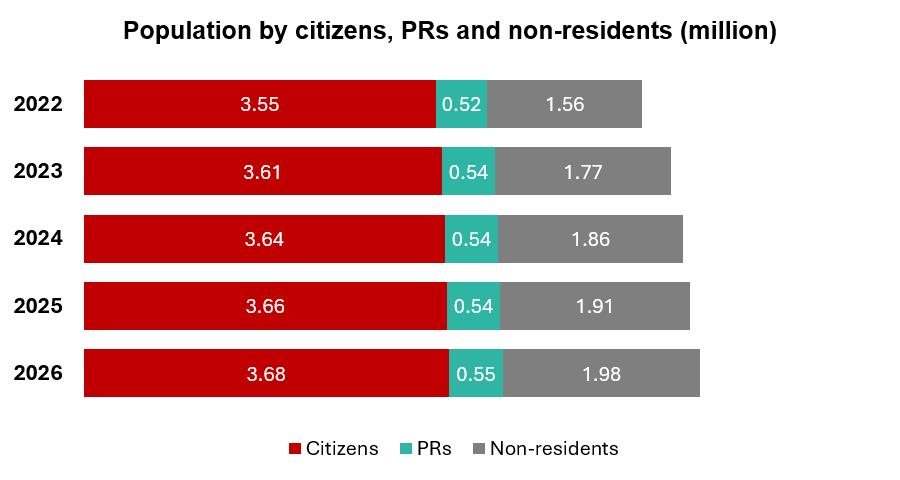
Population is also growing. Singapore’s total population rose by 10% from 5.64 million in 2022 to 6.21 million in 2026. Most of that increase came from non-residents, who grew from 1.56 million to 1.98 million (+27%), while citizens grew from 3.55 million to 3.68 million (+4%). \
Chart 6: Singapore population by citizens, PRs and non-residents, 2022 to 2026.
Rising Values Across All Regions
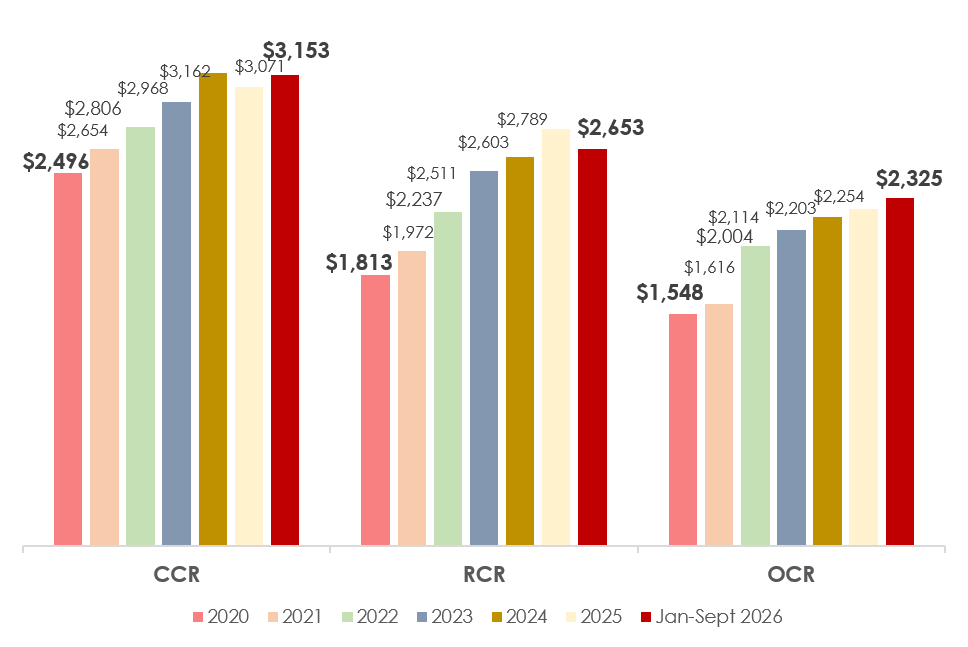
Between 2020 and the first nine months of 2026, new home prices rose in all three regions: 50% in the OCR (from $1,548 to $2,325 psf), 46% in the RCR (from $1,813 to $2,653 psf) and 26% in the CCR (from $2,496 to $3,153 psf). As a result, the gap between the regions has narrowed. The median price for new OCR condominiums is now at about 74% of CCR prices, up from 62% in 2020. Meanwhile, the median new sale price for RCR condominiums is at about 84% of that for new CCR condominiums, up from 73% in 2020.
The median price for all three regions has moved at a different pace in recent years. The OCR median has risen every year since 2020 and is currently 3% higher than in 2025. The current CCR median of $3,153 psf is close to its 2024 peak of $3,162 psf and 3% above that for 2025. The RCR median is 5% below its 2025 peak of $2,789 psf, though still well above 2020 levels.
These trends are consistent with the land cost for each region in this article, where the OCR recorded the strongest bidding and price gains.
Chart 7: Median new home price by region, 2020 to 9M2026.
Where are the Opportunities?
Two large transformations are reshaping where value is created: Jurong Lake District (JLD) and Bukit Timah Turf City.
JLD is planned as the largest business district outside the CBD and a major hub for business, innovation and lifestyle, with around 100,000 jobs and 20,000 homes by 2040. More jobs, transport links and amenities support housing demand, and ongoing investment gives the area strong growth potential.
Land prices near Bukit Timah Turf City are already moving. In July 2025, the Dunearn House GLS site was awarded at $1,410 psf ppr. In May 2026, less than a year later, the GLS plot next to it was awarded at $1,625 psf ppr, 15.2% higher. A higher land cost makes it likely that the project on the second site will launch at higher prices.
Buyers should also look out for new business hubs. A good example would be the Paya Lebar and Ubi which is a fast-growing commercial hub creating quality jobs outside the CBD. Companies in technology, finance, healthcare and logistics are expanding there. The future relocation of the Paya Lebar Air Base will unlock land for homes, offices, parks and amenities, in line with the live-work-play vision of more jobs closer to home. As employment and residential developments grow together, demand for both commercial and residential property is well supported.
Three Takeaways For 2H 2026
- Land cost sets the price floor. CCR land price rose from $1,318 psf ppr in 2022 to $1,865 psf ppr in 2026, lifting median new launch prices from $2,653 psf to $3,154 psf.
- Income growth sustains demand. Household income is up 31% since 2016, which lends support to affordability
- Transformation leads value. The rare combination of housing, jobs and transport will give a boost to property values. This is clearly shown in the transaction of several neighbourhoods, from Tengah and Jurong Lake District to Turf City.